Section Progression Dashboard
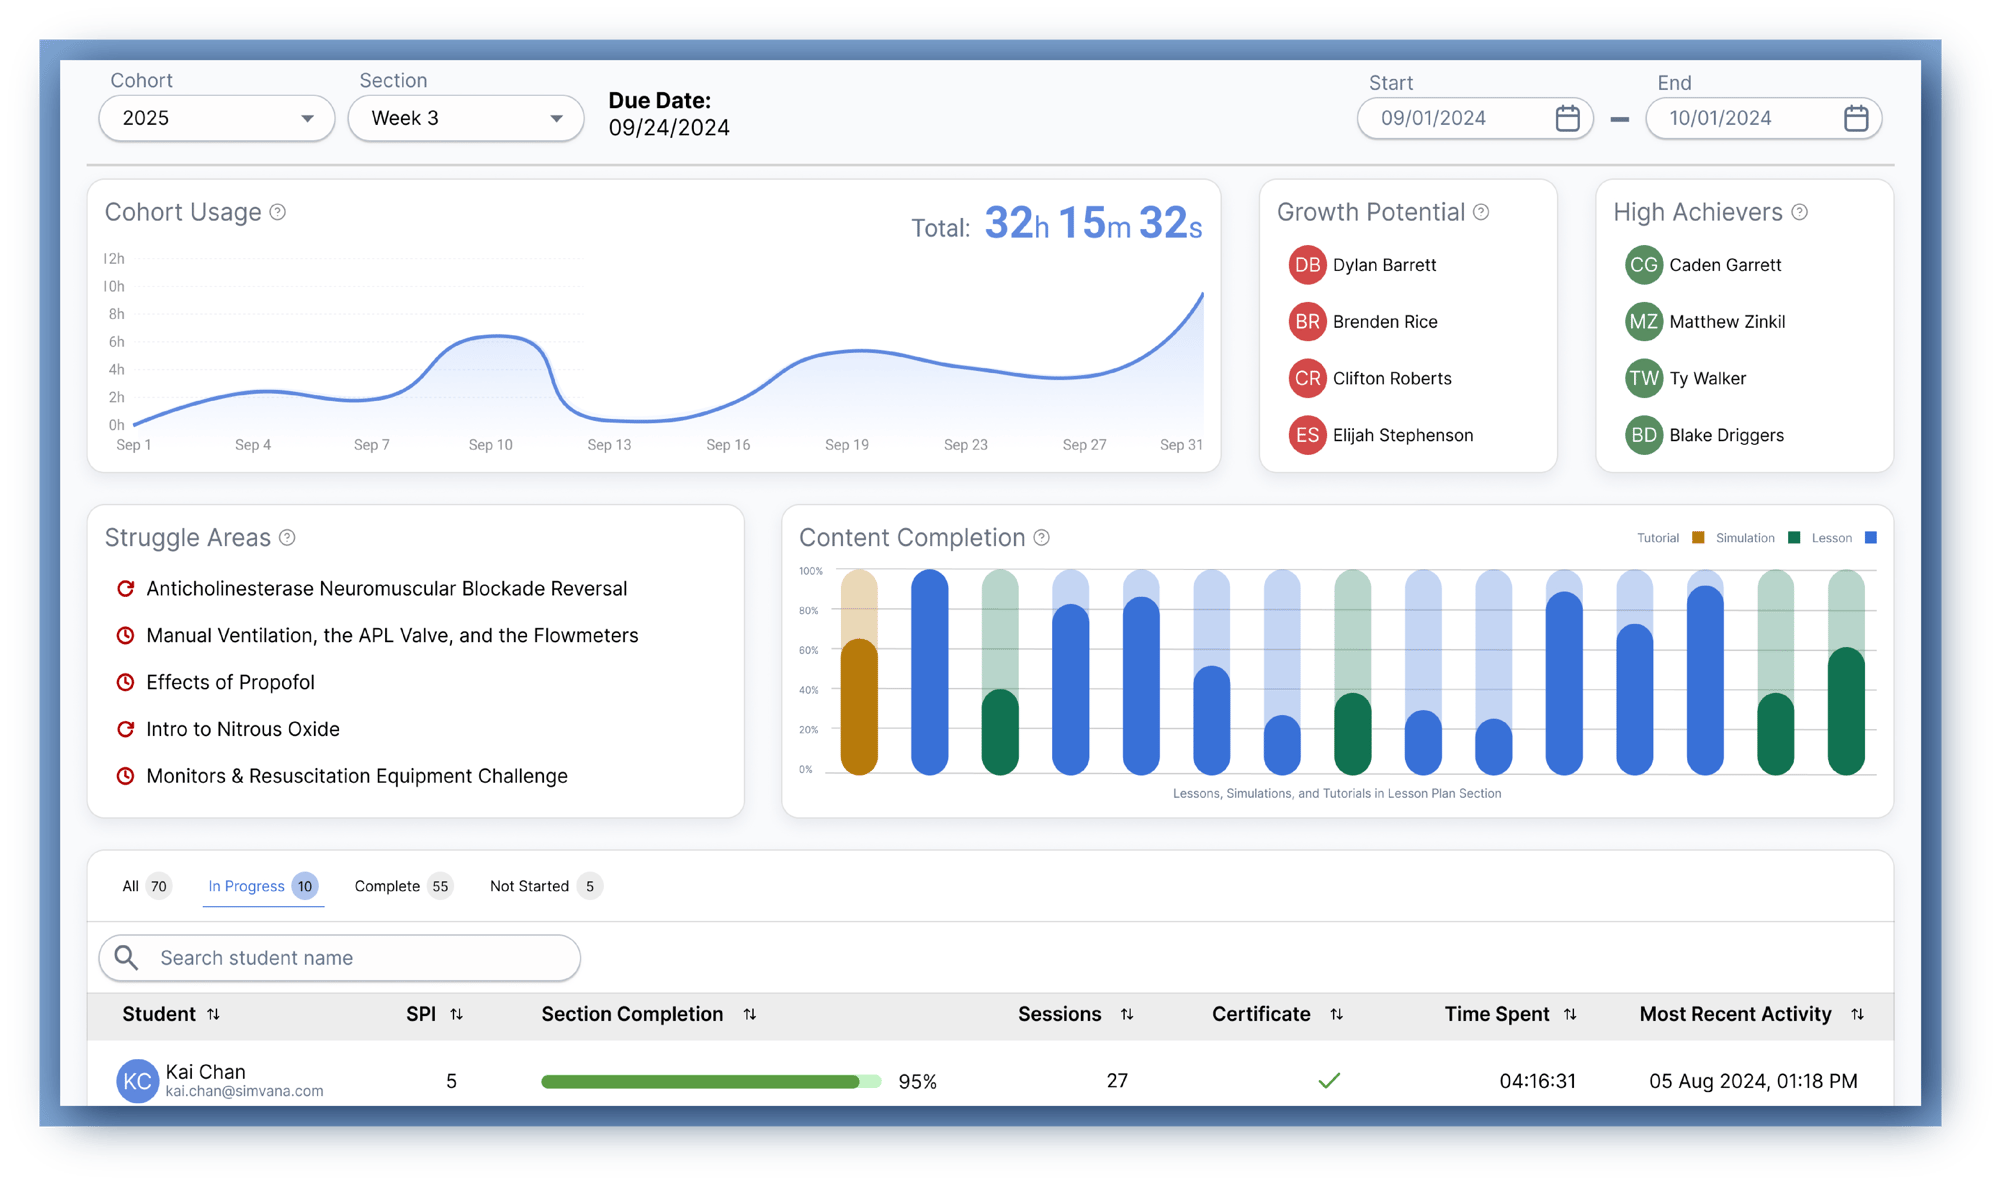
Automatic Identification of Key Trends
The Section Progression Dashboard provides a clear, data-driven view of cohort performance by combining live progress tracking with historical analysis. With automatic detection of key performance indicators, it identifies areas of strength and challenges, helping you intervene early and effectively.
- Monitor student activity and progress in real-time to ensure learners stay on course.
- Analyze historical data to understand progress over time and adjust Lesson Planning accordingly.
- Automatic detection of positive and negative trends allows for targeted interventions at both the individual and cohort level.
- Reduce time spent on manual data analysis with a dashboard that streamlines the learning process and improves outcomes.
Save and Share Your Dashboard Views Effortlessly
The Section Progression Dashboard allows you to save and share filtered data views with just a few clicks. Filters are embedded into links and PDFs, making it easy to quickly re-access data snapshots or share insights with others.
- Save filtered views as bookmarks to keep important data easily accessible whenever you need it.
- Generate PDF reports for seamless sharing with those who may not have dashboard access, ensuring everyone stays informed.
- Whether reviewing a specific week’s data or tracking a particular metric, saved filters ensure consistent data views across sessions.
Meet the SIMVANA Performance Index (SPI)
The SIMVANA Performance Index (SPI) is not a traditional score—it’s an aggregated ranking that reflects how each learner compares to their peers within the cohort. By combining metrics like engagement, completion rates, and assessment outcomes, SPI provides a clear picture of relative performance. This allows you to identify students needing support without guesswork, ensuring that interventions are timely and effective. SPI is a game-changer for tracking cohort dynamics and boosting learning outcomes.
Track Key Metrics with Section Progression Widgets
With several specialized widgets, the Section Progression Dashboard provides a clear, data-driven view of learner performance. These widgets track everything from content completion to growth potential, equipping you with actionable insights to enhance training outcomes.
Filter Dashboard Data by Cohort, Section, or Date
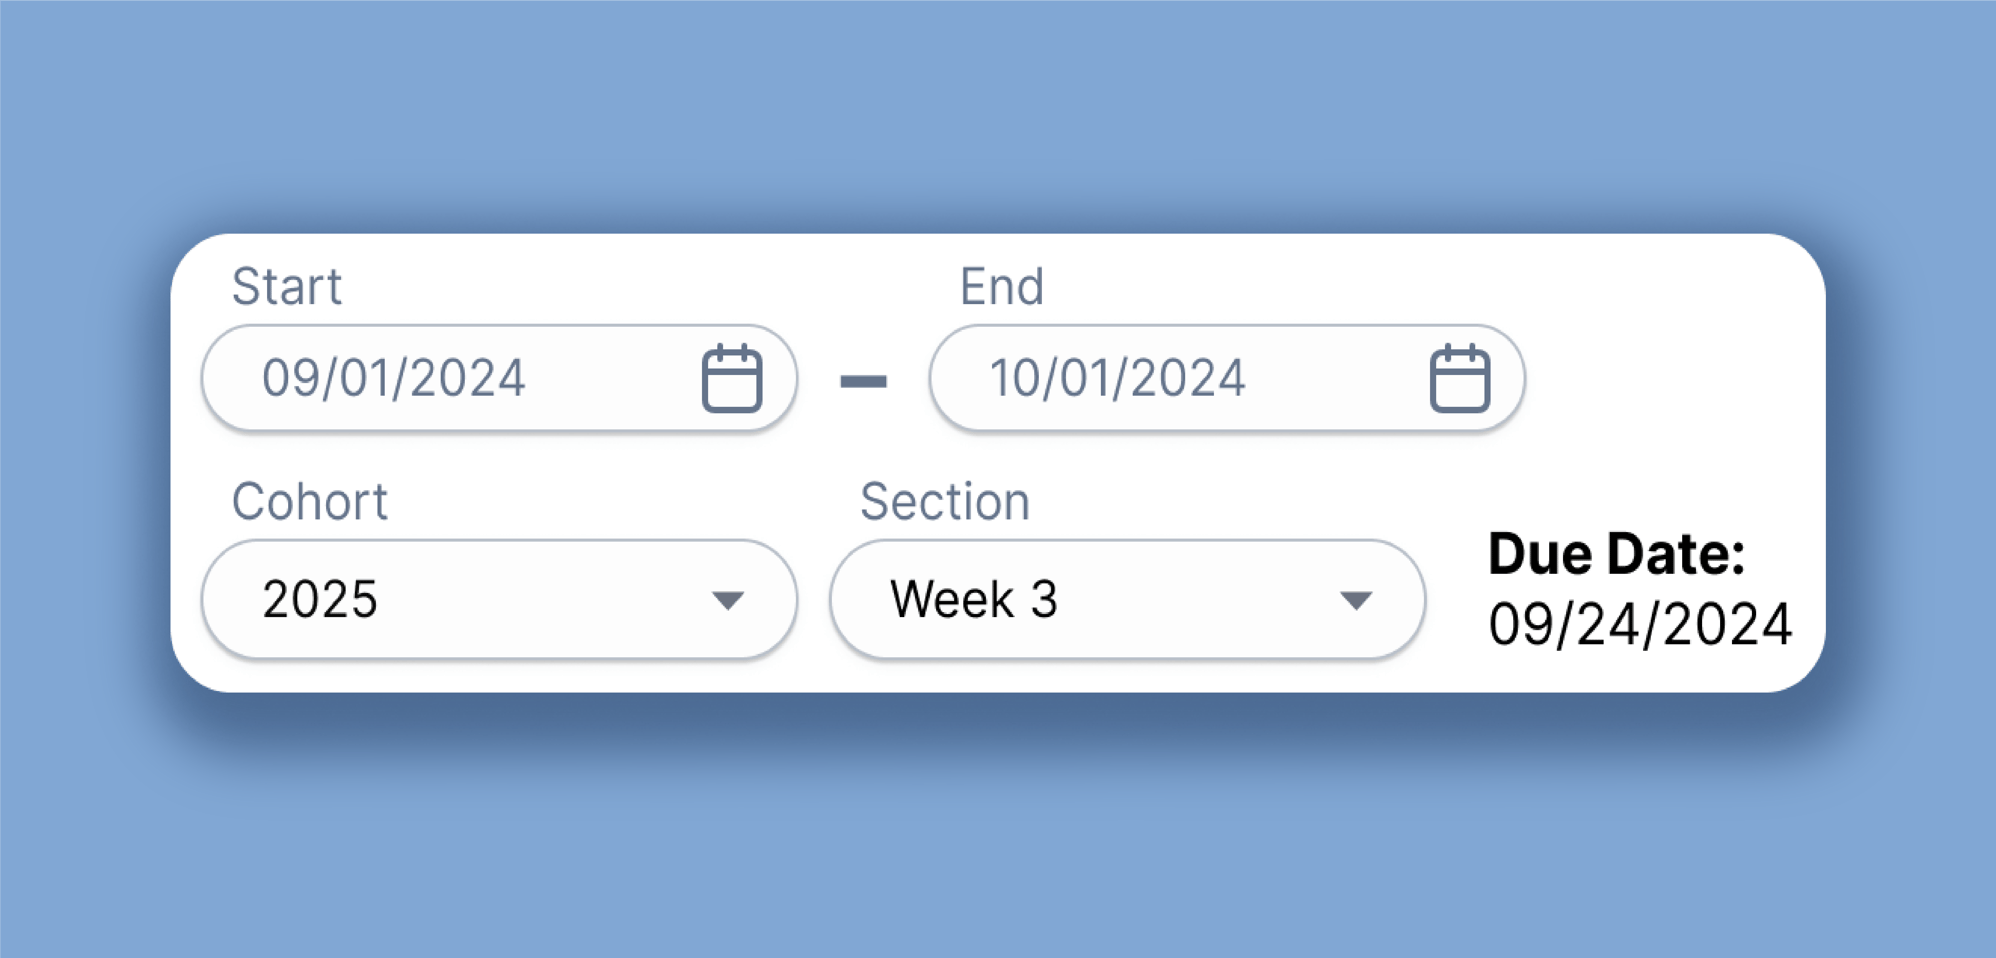
The Data Filtering widgets allow you to narrow down your view to a specific cohort, section, and timeframe, ensuring you analyze the data that’s most relevant. Whether you’re focusing on a particular week’s performance, a specific cohort, or a lesson plan section, use these widgets to adjust the dashboard to match your focus. Once filters are set, you can easily bookmark the filtered link or generate a PDF to save that view for future reference. This makes it ideal for monitoring recurring trends or sharing specific insights with colleagues.
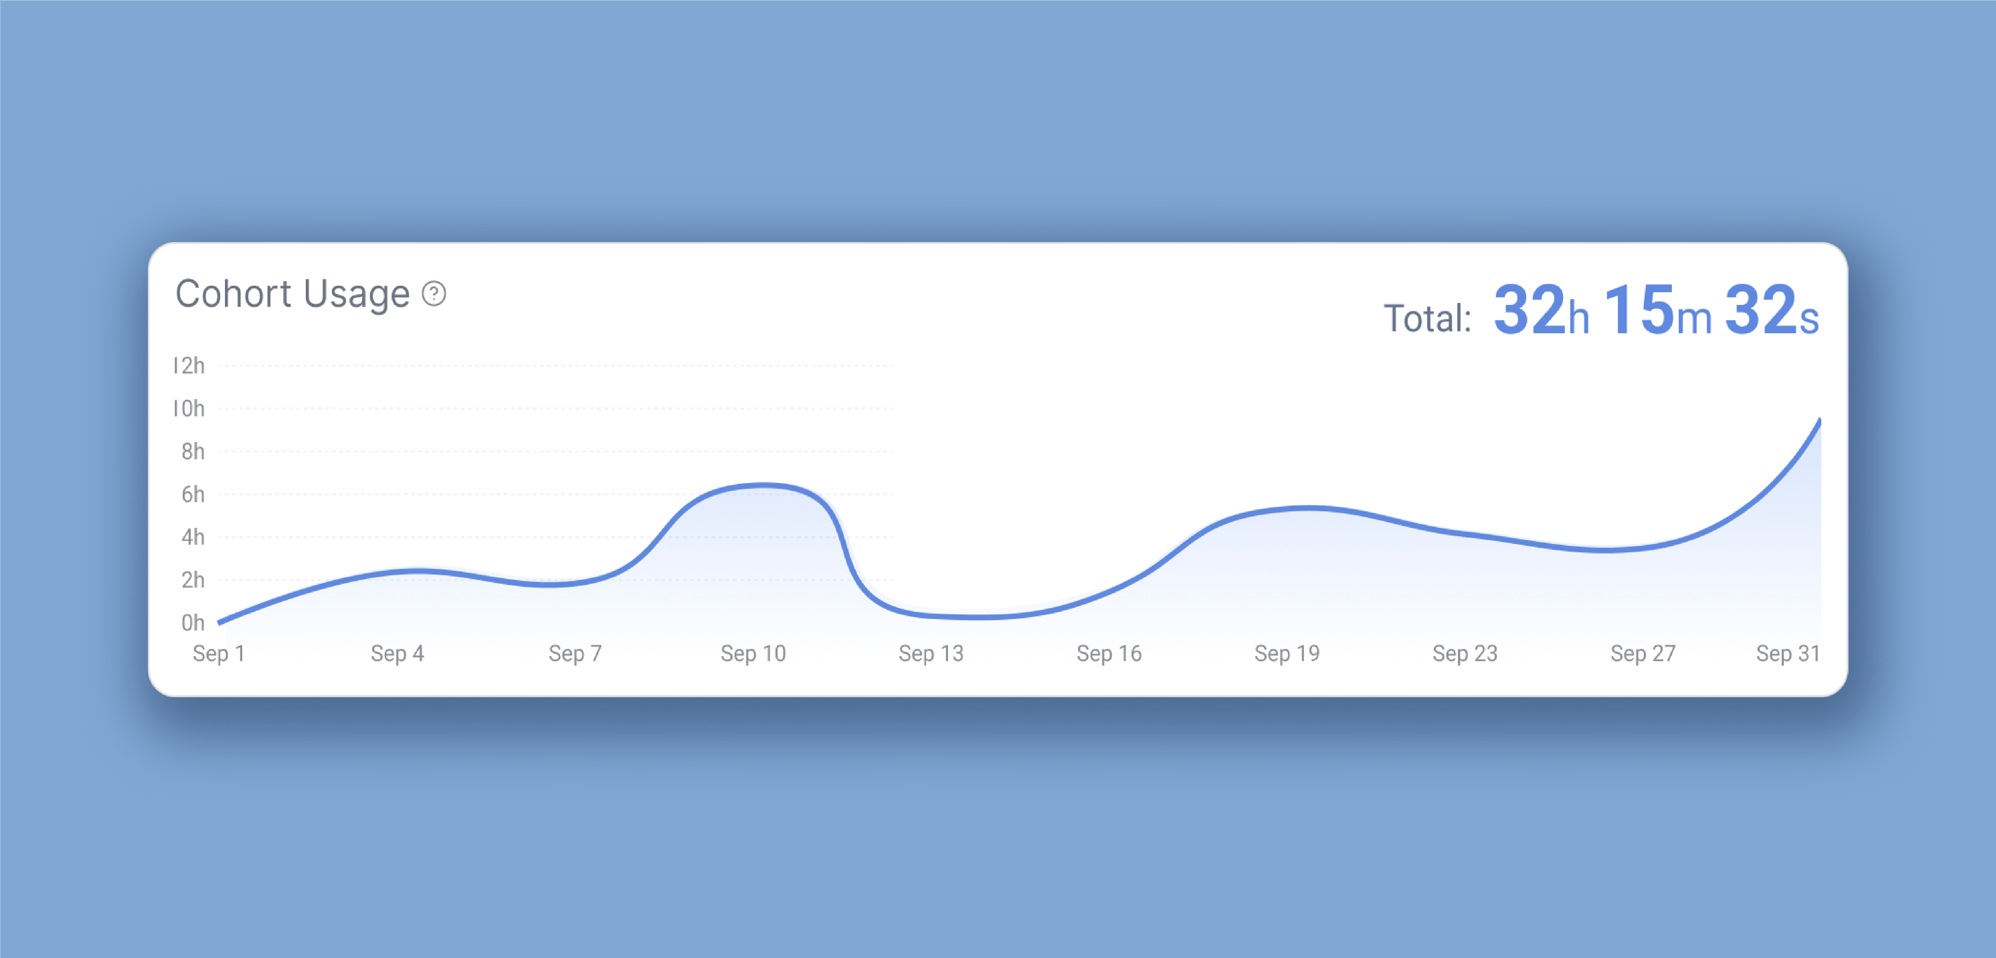
Engagement Trends & Usage Time
Track how your cohort engages with Lesson Plan content through a timeline that shows activity trends and total usage time. This widget highlights when students are most active, offering insights into peak learning periods and identifying sections that may need adjustments to improve engagement.
.png?width=1996&height=994&name=GrowthPotentialHighAchievers-edited%20(1).png)
Automatic Analysis of Cohort Performance
Powered by the SIMVANA Performance Index (SPI), this widget automatically ranks your cohort, highlighting both leaders and students who may need additional support. It’s designed to provide a clear, at-a-glance view of relative performance, helping you focus your efforts where they’re needed most. Explore SPI in detail to understand how it shapes these insights.
.png?width=1993&height=992&name=Struggling%20Content-edited%20(1).png)
Spot Learning Challenges Within Your Cohort
The Struggle Areas Widget shows where students in your cohort struggle the most. It does this by comparing two key metrics—time to complete and attempts to first completion—against the entire user base. This helps instructors quickly identify lessons, tutorials, or simulations that need extra focus.
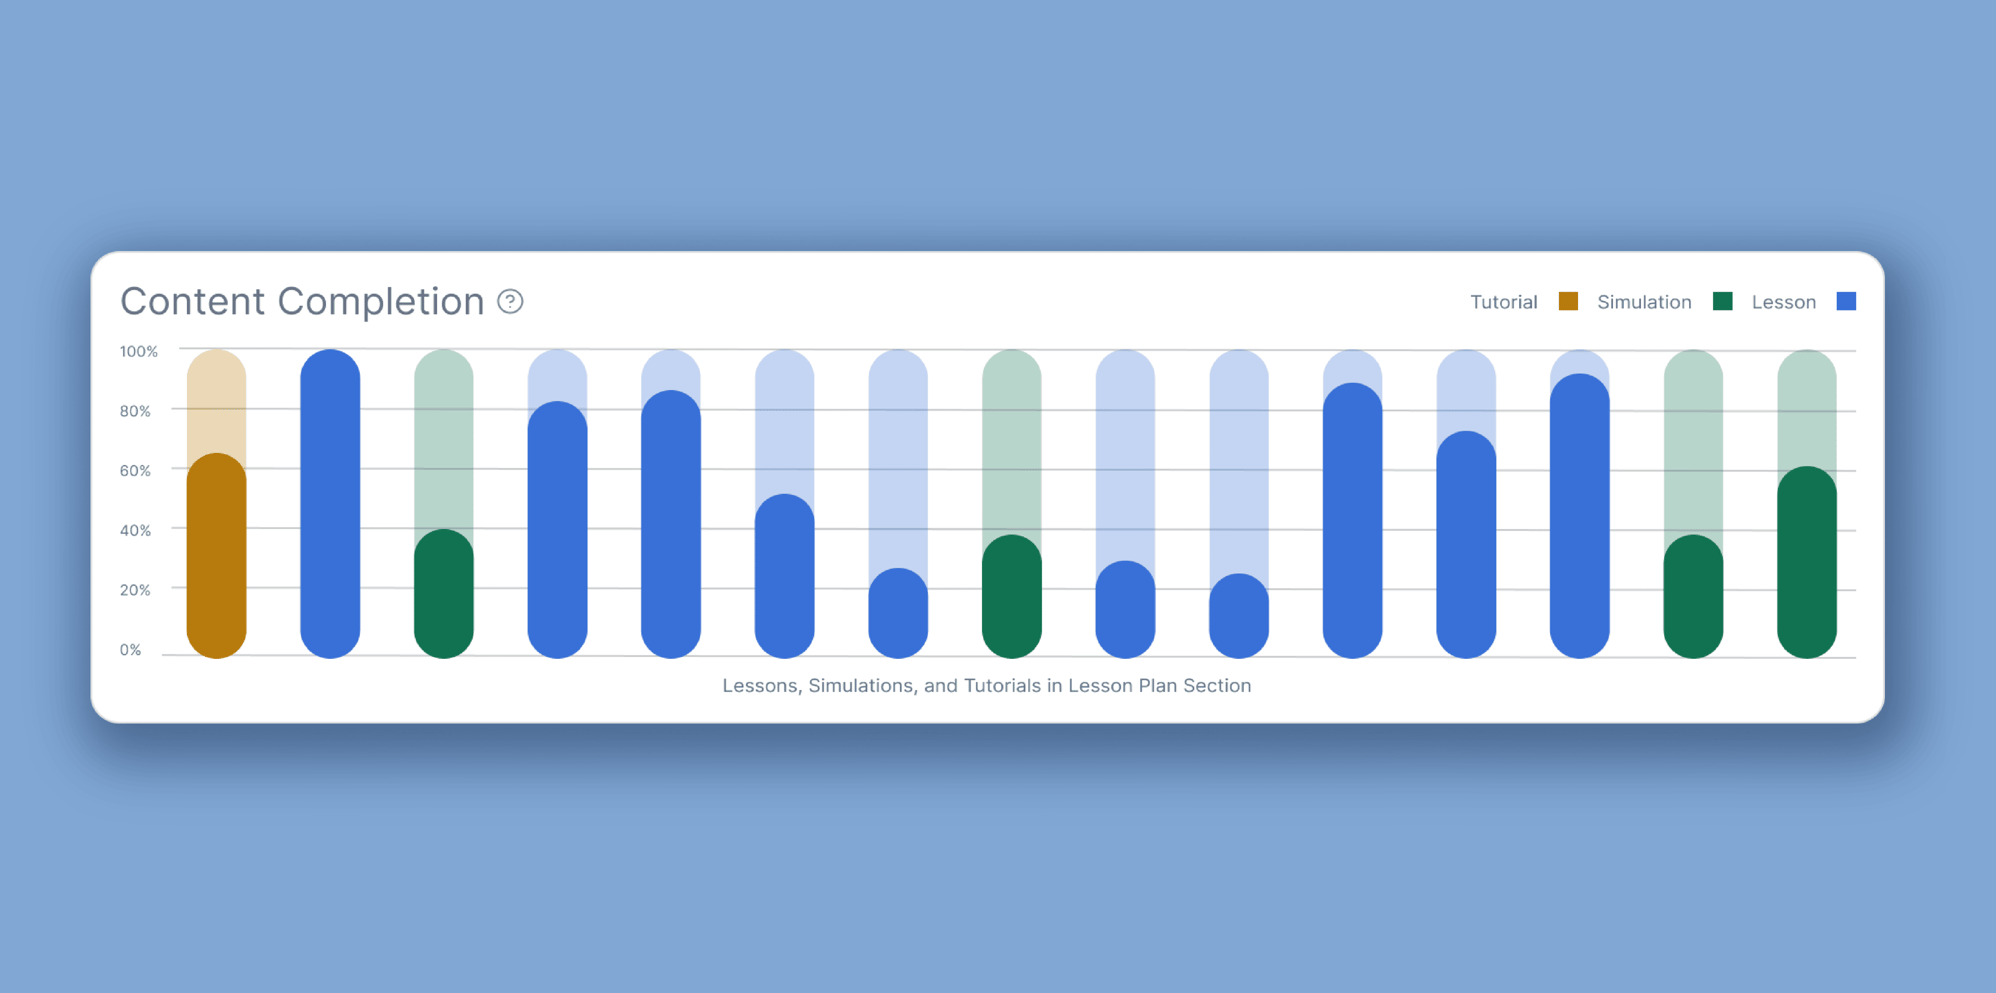
Section Completion Overview
The Section Completion Overview Widget gives a clear picture of how many students have finished each lesson, tutorial, or simulation. It breaks down your lesson plan into individual pieces, making it easy to see exactly where students are progressing and where they might need more support.
.png?width=1996&height=994&name=Cohort%20Table-edited%20(2).png)
Detailed Cohort Metrics Table
See all key learner metrics in one place with the Cohort Table. It displays SPI rank, section completion percentage, session count, certificate creation status, total time spent, and the timestamp of the most recent activity for each member of the cohort. Each column can be sorted by clicking, allowing for easy comparison of individual performance. This table view provides clear insights for targeted interventions and progress tracking.